PINE SCRIPT v6 GRAPHICS ENGINE
Render in 3D
Directly on
Your Charts
A fully fledged 3D graphical engine designed for TradingView. Build detailed meshes, transform them in world space, project them through perspective cameras, and run real point-lighting with shadows, all through a clean, object-oriented API.
Engineered from the ground up for technical analysts, algorithmic developers, and visualization specialists who demand production-ready 3D structures without mathematical gatekeeping.
Zero Trigonometry synchronization. Fully automated pipeline.
Planet Shadow Demo
3D CUBE ACTIVE
Planet Shadow DemoFull object permeance within the scene world, with sparse shadow grid projections, occlusion and face culling.
Shadow Grid
Render Mode
200k
Max Triangle Cap
1.6
Lines/Face Average
THE TWO-LAYER PARADIGM
"First-principle mechanical building blocks, paired with production-ready high-level wrappers."
Pine3D is engineered to cater to both graphic-engine architects and domain-specific developers. You can write customized mathematical vectors from scratch, or load an entire Volatility Surface in just a few lines of chainable code.
STAGE 01
Scene
Main graph coordinator managing light vectors and mesh registers.
STAGE 02
Mesh
Object nodes combining raw vertices, faces, textures, and tags.
STAGE 03
Camera
Dual projection viewer carrying orbit, lookAt, and fov bounds.
STAGE 04
Light
Dynamic point/directional vectors casting shadow matrix maps.
STAGE 05
Render
Single-line draw pipeline carrying occlusion and back-face culls.
Contour Band Rendering
via Bridge Stitching
Pine Script enforces a strict ceiling of 100 polylines per indicator. Naive rendering burns through this within a few hundred faces. Pine3D breaks this structural constraint.
Degenerate Bridge Stitching
Our algorithm collapses every disjoint face falling into the same height band into one continuous polyline path per band. By threading invisible, zero-width bridges between separated segments, a single polyline can render up to 2,000 disconnected triangle equivalents, boosting mesh limits to 200,000 faces.
SURFACE_SHADED_LANDSCAPE40 x 40 RESOLUTION
RSI values over multiple periods for the last X BarsAXIS SNAPPING: ENABLED
SURFACE_STATIC_RENDERGRIDBOX + LABELS
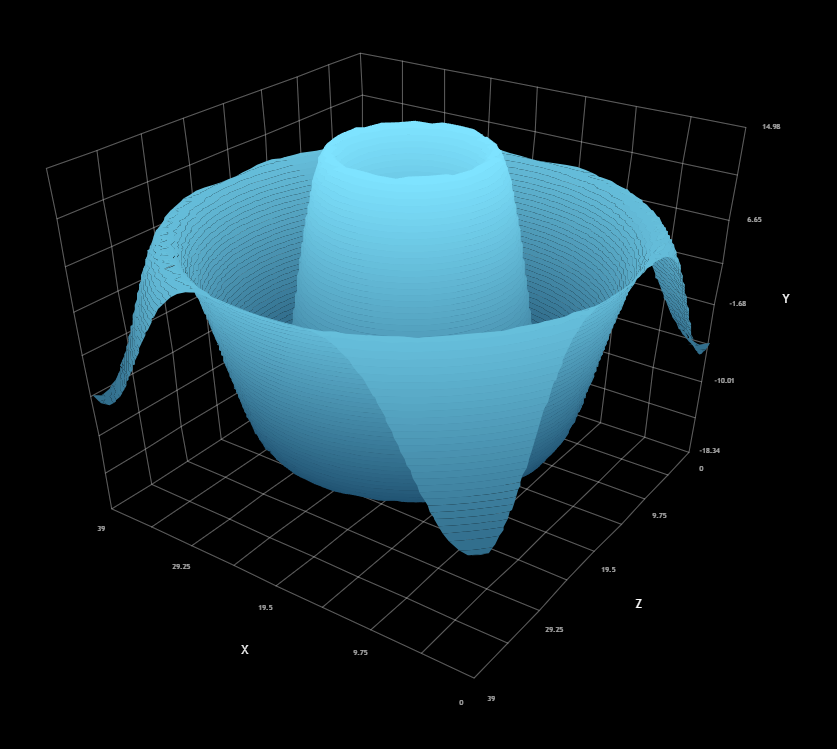
Water DropletCAMERA PROJECTION: STABLE
Surface Output Controls
The still render is where the surface pipeline becomes inspectable: non-uniform coordinates, cage helpers, axis labels, and contour-band stitching all resolve into a readable chart-native scene.
Non-Uniform Grids
Accepts custom row and column positions via arrays (`axisX`/`axisZ`). Renders Option Volatility strike pricing (logarithmic) or Order Book depths (asymmetrical) without prior resampling.
Contour Cage Helpers
The chainable `gridBox()` and `gridLabels()` methods automatically build bounding frames, coordinate grids, and axis labels that snap and dynamically refresh as data ranges update.
Capacity comparison: Strip-Stitch vs. Contour Band Stitching
STRIP STITCHING
Adjacent Same-Color Runs
Efficient only when matching shaded faces sit next to one another; separated regions require additional drawing paths.
CONTOUR BAND ENGINE
Disconnected Same-Band Faces
Stitches non-adjacent faces that share one contour color, allowing far more complex geometries under the same polyline budget.
TRAIL3D_STREAM_OSCILLATORROLLING BUFFER CAPACITY: 300
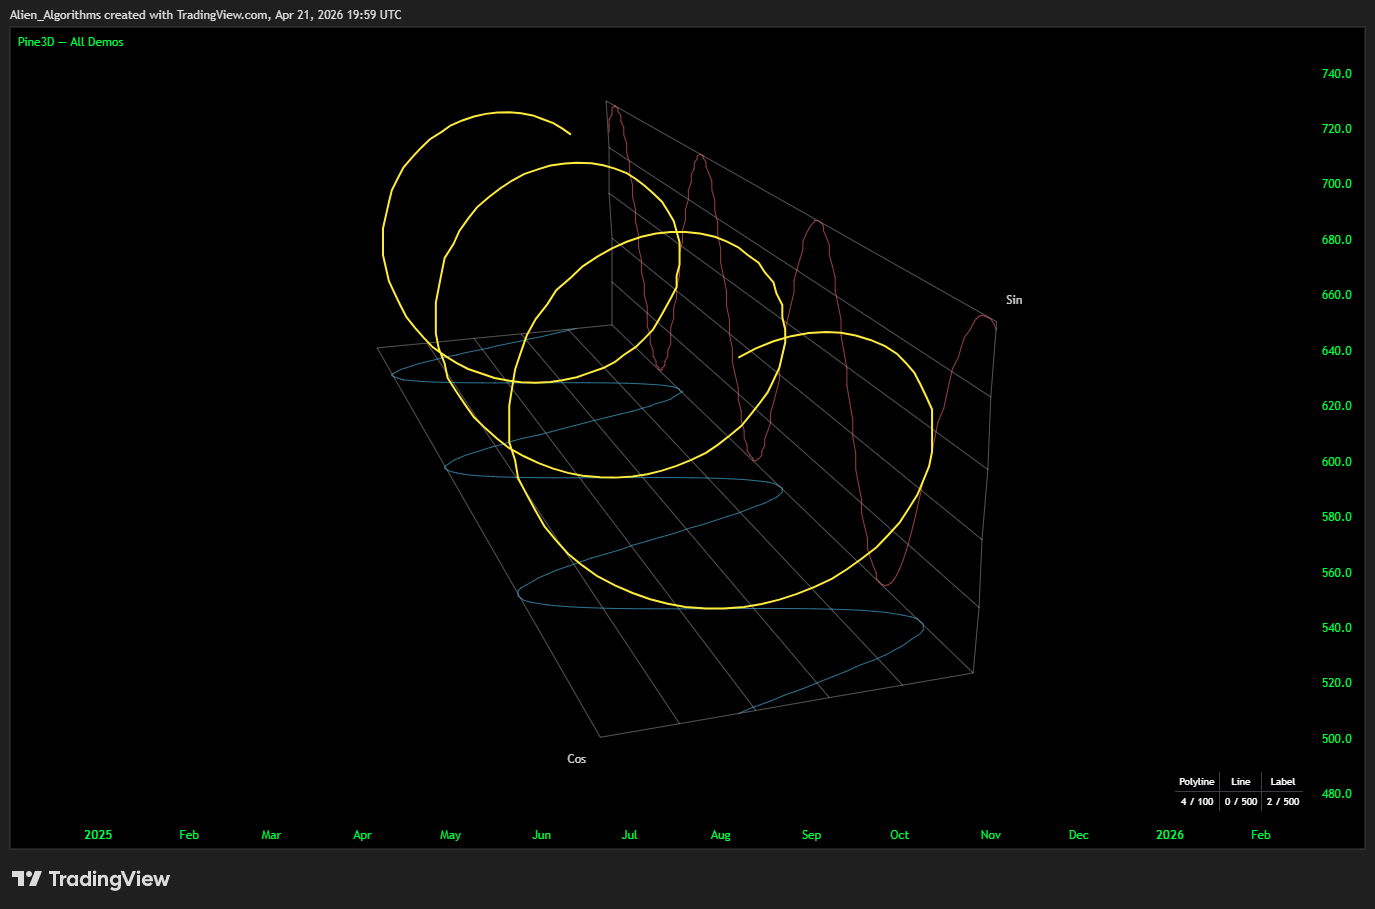
BUFFER ROLLING VALIDATEDPROJECTION OCCLUSION: ACTIVE
Trail3D: Streamed
Oscillator Paths
Visualize two correlated time series as a 3D ribbon evolving through time. The Trail3D primitive handles the rolling sample buffers, geometry building, and perspective culling automatically.
01
Auto-Normalized Bounding Cage
Incoming samples are scaled on-the-fly against the rolling window's dynamic min/max. The resulting ribbon always fits cleanly inside the bounding wireframe cage, preventing chart spill.
02
Dual Wall Projection Shadows
Spawns coordinated sub-polylines representing shadow projections onto the back wall and floor. All projection ribbons are correctly painter-sorted and occlusion-clipped against the scene geometry.
03
Correlated Vector Analysis
Ideal for plotting phase space portraits, Lissajous figures, attractor trajectories, and signal pair correlations (e.g., RSI vs. Money Flow Index, Volume vs. Volatility).
Simple sample push:
trail := p3d.trail3D(220.0, 200, color.yellow).cage(true)
if barstate.isconfirmed
    trail.pushSample(sinX, cosY)
    p3d.render(scene)
Bars3D: Categorical
3D Bar Charts
Turn any multi-timeframe series of values into a fully lit, depth-sorted 3D bar chart with automated labels in a single call.
In-Place updateBars()
Animate live data smoothly. The mutator refreshes heights, colors, and value labels in-place each bar, keeping TradingView's drawing allocation intact without reconstruction delay.
Downward Negative Extrusion
Signed data series (PnL, delta histograms) are calculated automatically. Negative values extrude downward below the floor plane with reversed face winding and correct directional shading.
Deep Depth-Sorted Labels:
The chainable `barLabels(catNames, valNames)` helper coordinates category labels at the base of each bar and numeric value labels at the top. The label coordinates are projected and painter-sorted against all solid meshes, preventing overlapping visual artifacts.
BARS3D_GEOMETRY_CANVASIN-PLACE
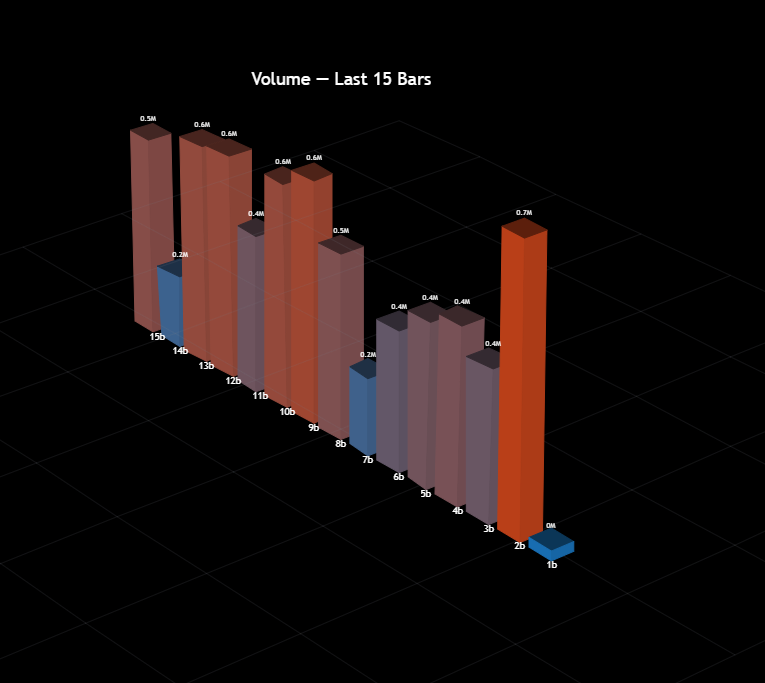
FACING CULL: ENABLEDDEPTH CLIPPED: STABLE
SCATTER_BATCH_LABELS500 BATCH POINTS
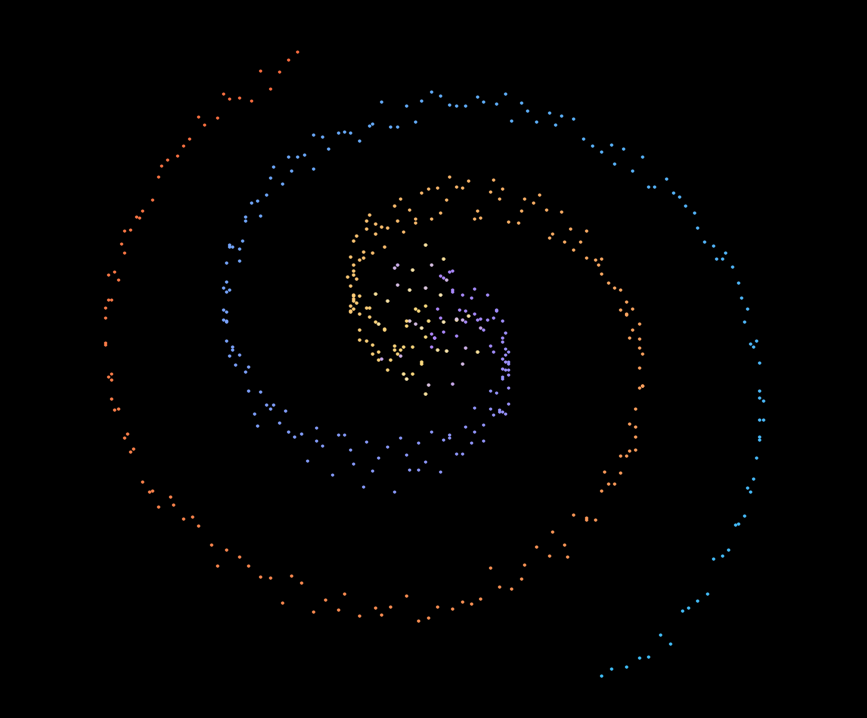
OCCLUSION DEPTH SEALSGLYPH_PRES: ACTIVE
Scatter Clouds: Points
in 3D Space
Pine3D treats dense scatter point clouds as a primary, optimized use-case. We batch coordinates using the `Label3D` primitive directly into the main sorting pipeline.
01
500 Labeled Points Budget
Push up to 500 coordinates anywhere in 3D space in a single batch operation (`scene.add(array<Label3D>)`). The engine painter-sorts and clips every point against solid objects automatically.
02
Fully Customizable Point Glyphs
Each point supports independent textColor, bgColor, custom tooltips, and any `label.style_*` symbol shape (circles, triangles, squares, diamonds, flags) and `size.*` configurations.
03
Real-Time Animation Mutations
Animate point coordinates without rebuilding geometry. Direct point fields assignment (`pt.position := vec3(...)`, `pt.textColor := color.aqua`) is read dynamically every single frame.
HISTORICAL CASE STUDY
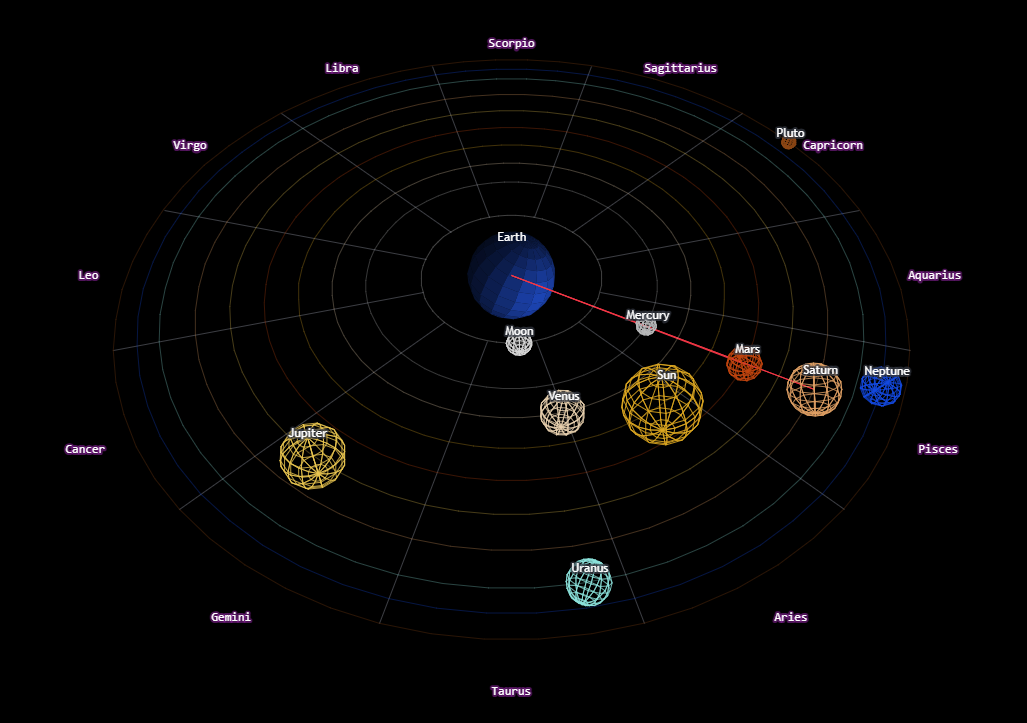
Recreating the 3D Solar System
Following the publication of our original 3D Solar System in 2024, Pine3D rebuilds the concept as a reusable scene-graph workflow rather than a one-off hardcoded visualization.
To demonstrate its power, we rebuilt the entire 3D Solar System on top of the library. The result is a compact demonstration of reusable cameras, meshes, lighting, occlusion, and drawing-budget control:
~1/5
Original Code lines
33%
Drawing budget used
*Engineered with automatic occlusion and back-face culling to preserve drawing budgets.
DEVELOPER RESOURCES
Simple, Object
Oriented API
Say goodbye to vector array juggling. Build scenes with a persistent `Scene` coordinator and chainable properties directly on objects.
Simple_Orbit_Scene.pine
Pine Script v6//@version=6
indicator("My First 3D Scene", overlay = false, max_polylines_count = 100, max_lines_count = 500, max_labels_count = 500)
import Alien_Algorithms/Pine3D/1 as p3d
var p3d.Scene scene = p3d.newScene()
var p3d.Mesh sun = na
if barstate.isfirst
scene.setLightDir(1.0, -1.0, 0.5).setAmbient(0.3)
sun := p3d.sphere(50.0, 16, 12, color.orange).setTag("sun")
scene.add(sun)
p3d.wireGrid(scene, 300.0, 300.0, 6, 6, color.new(color.gray, 80))
scene.camera.orbit(35.0, 25.0, 220.0)
if barstate.islast
sun.rotateBy(0.0, 1.5, 0.0)
p3d.render(scene, lighting = true)BEST PRACTICE DESIGN PATTERNS
The Pine3D Lifecycle
To maximize CPU performance and maintain lag-free TradingView operations, follow our standard design pattern lifecycle:
Performance Notice
Always declare the persistent `Scene` and primary `Mesh` elements using the `var` keyword. Build geometry strictly once inside the `barstate.isfirst` conditional block, then mutate fields on subsequent bars.
Stage 01 // Scene Initialization
Establish the persistent UDTs
Declare your Scene using `newScene()`. Set up camera parameters, lights, shadow biases, and viewport screen positions (`guiShift` / `yOffset`) once inside `var` scopes.
Stage 02 // Geometry creation
Build Meshes in barstate.isfirst
Create primitives (`sphere()`, `cube()`), or construct custom vertex arrays (`customMesh()`). Build grid overlays (`wireGrid()`), attach chainable label helpers (`barLabels()`), and load them into the persistent Scene.
Stage 03 // In-Place Mutation
Animate fields dynamically
On subsequent bars, run in-place mutators (`updateBars()`, `updateSurface()`) or direct vector changes (`moveTo()`, `rotateBy()`). This avoids rebuilding heavy vertex arrays every frame.
Stage 04 // Pipeline projection
Call render() once per bar close
Call the `render(scene)` loop. The engine resolves world space transforms, runs back-face and occlusion culling filters, evaluates ambient lighting shading, and projects coordinates onto the chart viewport.
DETERMINISTIC VISUAL PARITY
Pine3D is designed to deliver consistent visual structures in historical and live chart rendering. Vertex coordinates, depth-sorted layers, and light reflections are locked and sealed on closed bars, reducing redraw anomalies and supporting visual consistency.
ADVANCED PIPELINE OPTIMIZATION
Features aggressive, built-in pipeline optimizations to manage CPU workloads: world vertex caching, shadow grid caches, view-projection caching, back-face culling, and sparse occlusion raster filters (`occlusionRaster`). Keep chart speeds high at high resolution.
INSTANT LIBRARY ACCESS
Pioneer 3D Graphics
Visualize Multi-Dimensional Data
Deploy the Pine3D engine on your own indicators. Render Option Surfaces, customize bars3D charts, and stream Trail3D ribbon paths inside your TradingView scripts today.
Quant conceptualized and built by Alien_Algorithms.